WHAT WE HAVE ON THIS PAGE
Introduction
Fitness Trackers Statistics: As of reports, the global market size of fitness trackers is expected to reach around $182.90 billion by the end of 2030 with an annual growth of 19.1% from 2023 to 2030. The industry is progressing rapidly due to the higher integration of consumer-based wearable technologies into health research industries. In this digital world, rising demands of technology are enabling the growth of the fitness tracker industry in the coming years. In addition, after the COVID-19 pandemic, individuals are becoming more dependent on fitness trackers. The article includes several analyses of the market such as revenue share, segmental analysis, demographics, regions, countries, shipments, advantages, etc.
These Fitness Tracker Statistics include insights from various aspects that provide light on how fast the market is growing around the world in recent days.
Editor’s Choice
- According to the reports of Statista analysis, revenue earned by the worldwide market of fitness trackers is expected to be $67.23 billion by the end of 2023.
- Whereas, by the end of 2028 the fitness tracker market volume is supposed to reach $103.30 billion with a CAGR of 8.97% from 2023 to 2028.
- As of 2023, the user penetration of fitness trackers is going to be 5.35% and 6.04% by the end of 2028.
- By the end of 2023, the expected average revenue per user is predicted to reach $163.70.
- In 2023, China has earned the highest revenue around the world with almost $23,150 million.
- As the fitness trackers market is segmented into 3 parts, thus by the end of 2023 average revenue per user in smartwatches ($201.20), Smart bands ($74.87), and smart scales ($44.93).
- In 2023, revenue was earned from Smartwatches ($44.15 billion), Smart bands ($19.52 billion), and Smart scales ($3.55 billion).
- As of 2022, the global fitness tracker market share by highest application is running (42.9%), by distribution channel is online distribution segment (62%), and by highest device type is Smart Watches (41.3%)
- As of reports, the highest fitness market size has been achieved by the North American region resulting in $22.48 billion.
What is a Fitness Tracker?
The fitness tracker is an electronic device that is enabled with various sensors and batteries, which help in tracking orientation, movement, and trails of various, heal-related activities.
Some best fitness trackers cost in 2023 across the globe are Amazfit GTR 4 (costs $200), Garmin Venu Sq 2 (costs $250), Garmin Fenix 7S Pro ($600), Oura Ring Gen 3 (costs $299), Amazfit Band 7 (costs $45), Garmin Vivomove Sport (costs $180), Apple Watch Series 9 (costs $329), Samsung Galaxy Watch 6 (costs $228), Google Pixel Watch 2 (costs $350), and Whoop 4.0 (costs $30).
General Statistics
(Source: mordorintelligence.com)
- As of the above figure analysis, the global fitness tracker market is expected to grow at a CAGR of 15.70% from 202 to 2028.
- According to the reports of Fortune Business Insights, the global fitness tracker market size is supposed to reach $53.94 billion by the end of 2023.
- According to Precedence Research reports, as of 2023 the fitness tracker market size is predicted to be $56.1 billion in 2023 and $258.48 billion by the end of 2032.
- The global leading manufacturers of fitness trackers are Apple Inc., Fitbit Inc., Garmin Ltd., and Xiaomi.
- According to Statista, global revenue earned by fitness or activity tracking wrist wearable in 2023 is expected to be $19.3 billion and shipment units are going to be 305 million.
- As of 2022, fitness tracker market share analysis by distribution channels is followed by online (62%), and offline (38%).
- Whereas, the overall market growth of the fitness tracker market is expected to reach 18.5% of CAGR from 2023 to 2032.
- As of reports in the global fitness tracker market, the largest share was achieved by the North American region with a CAGR of 15.5% from 2023 to 2031.
- According to Adjust report analysis, revenue earned by fitness wristbands and smartwatches is supposed to grow by more than $63 billion by the end of 2023.
Fitness Trackers Statistics by Market Revenue
(Source: market.us)
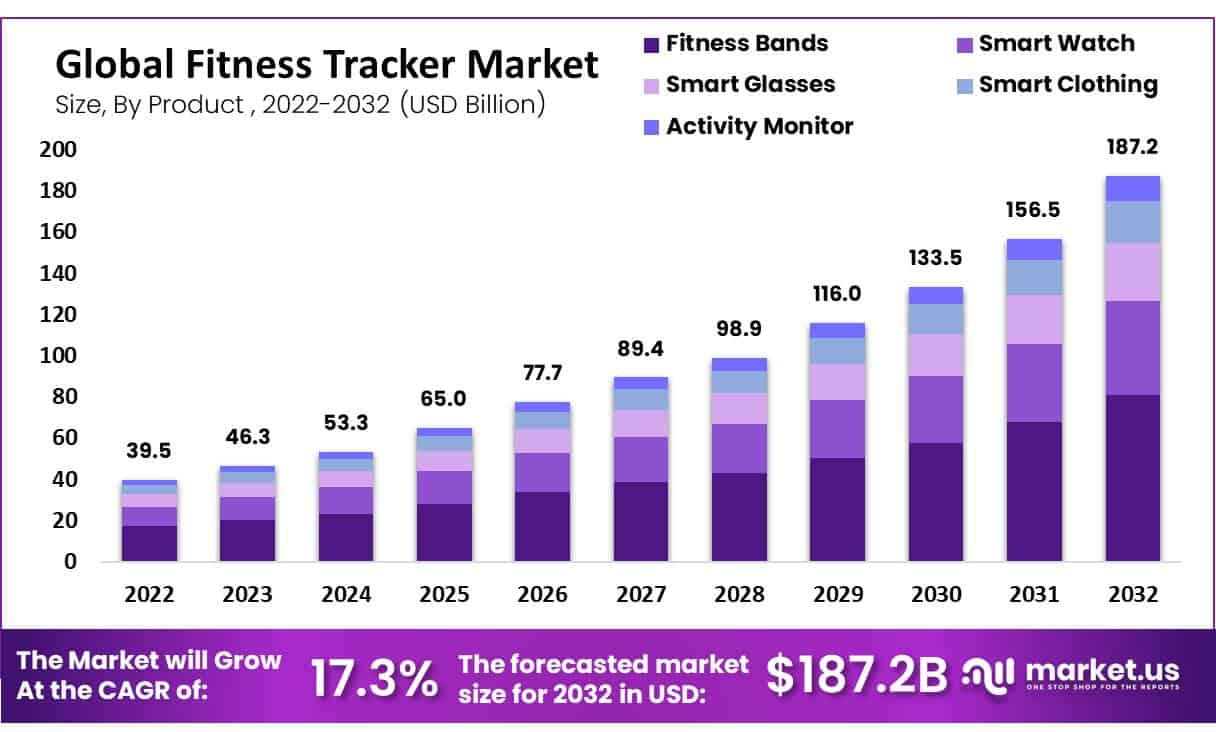
- As of the above graph analysis, the global fitness tracker market earned maximum revenue from fitness bands, smart glasses, activity monitors, smart watches, and smart clothing.
- In 2023, the global market valuation of fitness trackers is supposed to be $46.3 billion.
- The market growth of the global fitness tracker industry is expected to reach higher followed by 2024 ($53.3 billion), 2025 ($65 billion), 2026 ($77.7 billion), 2027 ($89.4 billion), 2028 ($98.9 billion), 2029 ($116 billion), 2030 ($135.5 billion), 2031 ($156.5 billion), and 2032 ($187.2 billion).
(Source: statista.com)
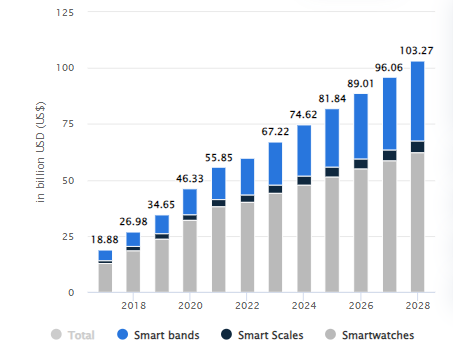
- As of the above graph analysis, the market is categorized into 3 segments such as smart bands, smart scales, and smartwatches. Thus, in 2023 global revenue earned by the smart fitness trackers market is expected to reach $67.22 billion.
- Furthermore, in the coming year revenue rates of the market are supposed to grow more followed by 2024 ($74.62 billion), 2025 ($81.84 billion), 2026 ($89.01 billion), 2027 (96.06 billion), and 2028 ($103.27 billion).
Fitness Trackers Revenue Statistics by Types

(Reference: statista.com)
- According to the reports of Statista, the fitness tracker’s market is segmented into 3 different segments such as smart bands, smart scales, and smartwatches.
- In the current year of 2024, the wearable technology market has observed substantial revenue generation with Smartwatches leading at $47.94 billion, followed by Smart bands at $22.78 billion, and Smart scales at $3.89 billion.
- Moving into the forecast year of 2025, it is anticipated that the market will continue its upward trajectory with Smartwatches expected to generate $51.58 billion, Smart bands poised to earn $26.08 billion, and Smart scales estimated to bring in $4.18 billion in revenue.
- The growth momentum is predicted to persist into 2026, with revenue from Smartwatches projected to reach $55.16 billion, while Smart bands are forecasted to contribute $29.38 billion, and Smart scales are expected to account for $4.48 billion.
- In 2027, the market is forecasted to maintain its expansion, with Smartwatches anticipated to generate $58.74 billion, Smart bands expected to earn $32.6 billion, and Smart scales projected to bring in $4.72 billion.
- Looking ahead to 2028, projections indicate a continued upward trend in revenue with Smartwatches expected to reach $62.46 billion, Smart bands forecasted to contribute $35.84 billion, and Smart scales estimated to earn $4.97 billion.
- This consistent growth across all categories signifies a robust and expanding market for wearable technology, highlighting the increasing consumer adoption and technological advancements driving the industry forward.
By Average Revenue Per User
(Source: statista.com)
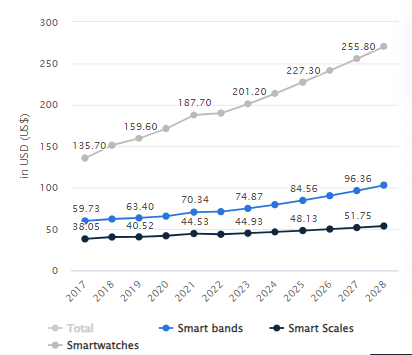
- As the fitness trackers market is segmented into 3 parts, thus by the end of 2023 average revenue per user in smartwatches ($201.20), Smart bands ($74.87), and smart scales ($44.93).
- In 2025, the average revenue earned per user is smartwatches ($227.30), Smart bands ($84.56), and smart scales ($48.13).
- In 2027, the average revenue earned per user is smartwatches ($255.80), Smart bands ($96.36), and smart scales ($51.75).
By Country-Wise Revenue
- In 2023, China earned the highest revenue in the fitness-tracker market around the world with almost $23.15 billion and $38.38 billion by the end of 2028 with a CAGR of 10.64% from 2023 to 2028.
- The other top countries revenue earnings in 2023 are followed by the United States ($16.14 billion), India ($5,325 million), Japan ($1,408 million), and the United Kingdom ($1,377 million).
- Furthermore, revenue earned by the fitness trackers market of other countries in 2023 are Australia ($525.40 million), Bangladesh ($135.40 million), Belgium ($261.80 million), Brazil ($634.30 million), Canada ($6.68.30 million), Colombia ($230.70 million), Denmark ($198.20 million), Egypt ($362.20 million), France ($21,234 million), Germany ($1,259 million), Hong Kong ($95.22 million), Indonesia ($522.70 million), Italy ($916.50 million), Kenya ($25.30 million), Latvia ($20.21 million), Malaysia ($148.10 million), Mexico ($576.10 million), Myanmar ($73.56 million), Netherlands ($377.20 million), Norway ($192.50 million), Philippines ($174.30 million), Russia ($814.30 million), Singapore ($139.80 million), South Africa ($259.60 million), Switzerland ($403.40 million), Taiwan ($123 million), Thailand ($193.20 million), Turkey ($492.50 million), Vietnam ($), and Zimbabwe ($65.48 million).
Fitness Trackers Statistics by Region
![]() (Reference: precedenceresearch.com)
(Reference: precedenceresearch.com)
- As of the above graph analysis, the North American region has accounted for the highest market share with 44% across the global fitness industry in 2022.
- Furthermore, other regions market shares are followed by Europe (25%), Asia Pacific (24%), Latin America (4%), and Middle East and Africa (3%).
- The largest share of the fitness tracker market was achieved by the North American region with a CAGR of 15.5% from 2023 to 2031.
- Whereas, the second largest and fastest growing region is Asia Pacific with a CAGR of 19.5% from 2023 to 2031.
Fitness Trackers Statistics by Segmentation
- The fitness market around the world is segmented by application, distribution channel, device types, components, connectivity, and operating system.
- According to Strait Research analysis, based on the application the market growth of the running segment is expected to reach a CAGR of 16.3% from 2023 to 2031.
- During the forecasted period from 2023 to 2031, based on the distribution channel the offline segment is going to contribute the highest share of 16.5% CAGR.
- Furthermore, among others based on device types; the highest contributor is the smartwatches segment with a market growth of 16.6% CAGR.
- Based on components, the highest contributor is the hardware sector with a market growth of 16.9%.
- Based on connectivity and operating system, the highest contributor is the Bluetooth and Android segment which is estimated to grow by 17.1% and 16.6% of CAGR respectively.
Fitness Trackers Statistics by Demographics
(Source: ncbi.nlm.nih.gov)
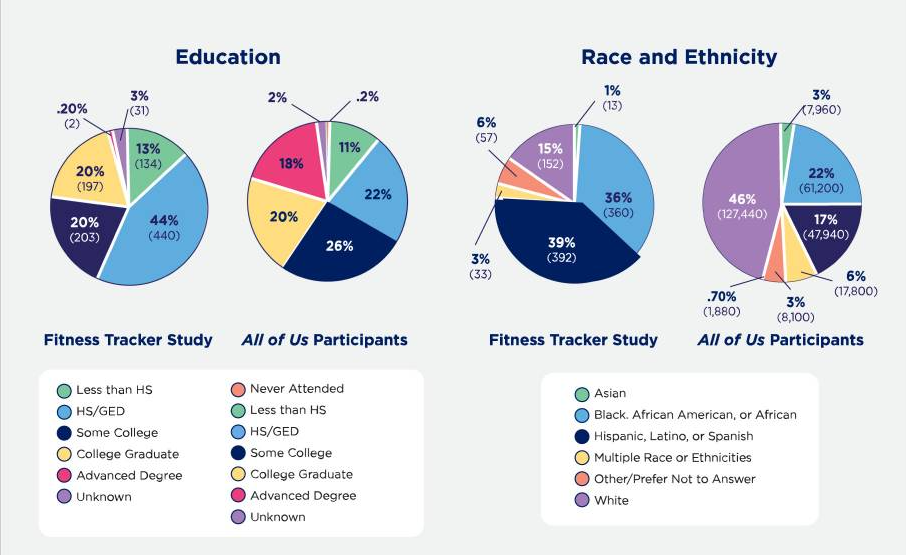
- According to the survey analysis of the United States National Center for Biotechnology Information, fitness tracker user statistics by race and ethnicity are followed by Hispanic (39%), non-Hispanic black or African American (36%), and non-Hispanic white American (15%).
- Users of fitness trackers by education are followed by less 9th grade (13%), HS (44%), 2 years college (20%), 4 years college (20%), and no users (3%).
- Users of fitness trackers by age are followed by 18-25 years (11%), 26-35 years (20%), 36-46 years (20%), 45- 55 years (21%), 56-65 years (19%), 66-75 years (8%), and above 76 years (2%)
- Users of fitness trackers by gender are followed by women (71%), men (25%), minorities (2%), and others (2%).
U.S. Fitness Trackers Statistics
- As of PubMed Central survey analysis, 21% of Americans are using fitness trackers.
- In which Apple watch users are 11%, others are Fitbit (6%), Garmin (10%), and others (4%).
- Around 58% of fitness tracker users are mostly used for tracking steps (27%), getting more exercise (16%), and for continuous analysis of heart rate (14%).
(Source: nitrocdn.com)
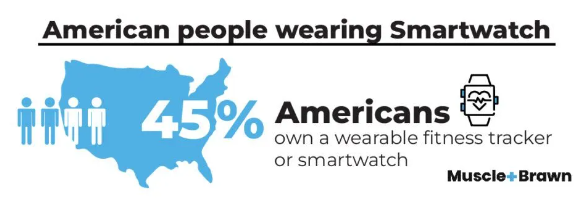
- Across the world in 2023, almost 45% of Americans are using wearable fitness trackers or smartwatches.
- 20% of people preferred Apple fitness trackers and 16% preferred Fitbit fitness trackers.
- 58% of people those are having annual income between $75,000 to $90,000 own fitness trackers.
- In the United States of America, owners of fitness trackers are Gen Z (70%), Millennials (57%), and women (51%).
- The main reasons for wearing fitness trackers are for tracking stress management (30%), exercise routine (27%), nutrition and diet (26%), and daily accumulated steps (24%).
Fitness Trackers Statistics by Brands
 (Reference: headphonesaddict.com)
- As of reports 2022 in the United States, fitness tracker user statistics by brand are followed by Apple (46%), Fitbit (38%), Samsung (16%), Garmin (8%), LG (7%), and Huawei (5%).
 (Reference: sammyfans.com)
- As of 2023 reports, the global market of Apple fitness tracker is expected to be 32% of the share.
- As of the above graph analysis, the market share of top manufacturers of fitness trackers is followed by Samsung (10%) Huawei (7%), Garmin (4%), Fitbit (1%), and others (46%).
Indian Fitness Trackers Statistics
- According to reports of Statista, revenue earned by the Fitness-tracker market is expected to reach around $ 5,325 million by 2023 with a revenue growth of 38.8% from last year.
- By the end of 2028, the market volume is going to reach around $14,200 million with a CAGR of 21.67% from 2023 to 2028.
- As of 2023, the expected average revenue per user is supposed to reach $128.90.
- Whereas, the user penetration rate in 2023 is 4.91% and 7.76% by 2028.
Fitness Trackers Statistics by Apps

(Source: verifiedmarketresearch.com)
- As of the above graph analysis, the global health and fitness app market is expected to be $35.71 billion with a CAGR of 20.02% from 2022 to 2030.
- According to recent reports analysis, 81% of customers around the world in 2023 have planned to use fitness tracker apps on wearables as well as on Smartphones.
- As of 2023, the market valuation of the fitness trackers apps industry is expected to reach $19.3 billion and $33.04 billion by the end of 2027.
(Source: storyblok.com)
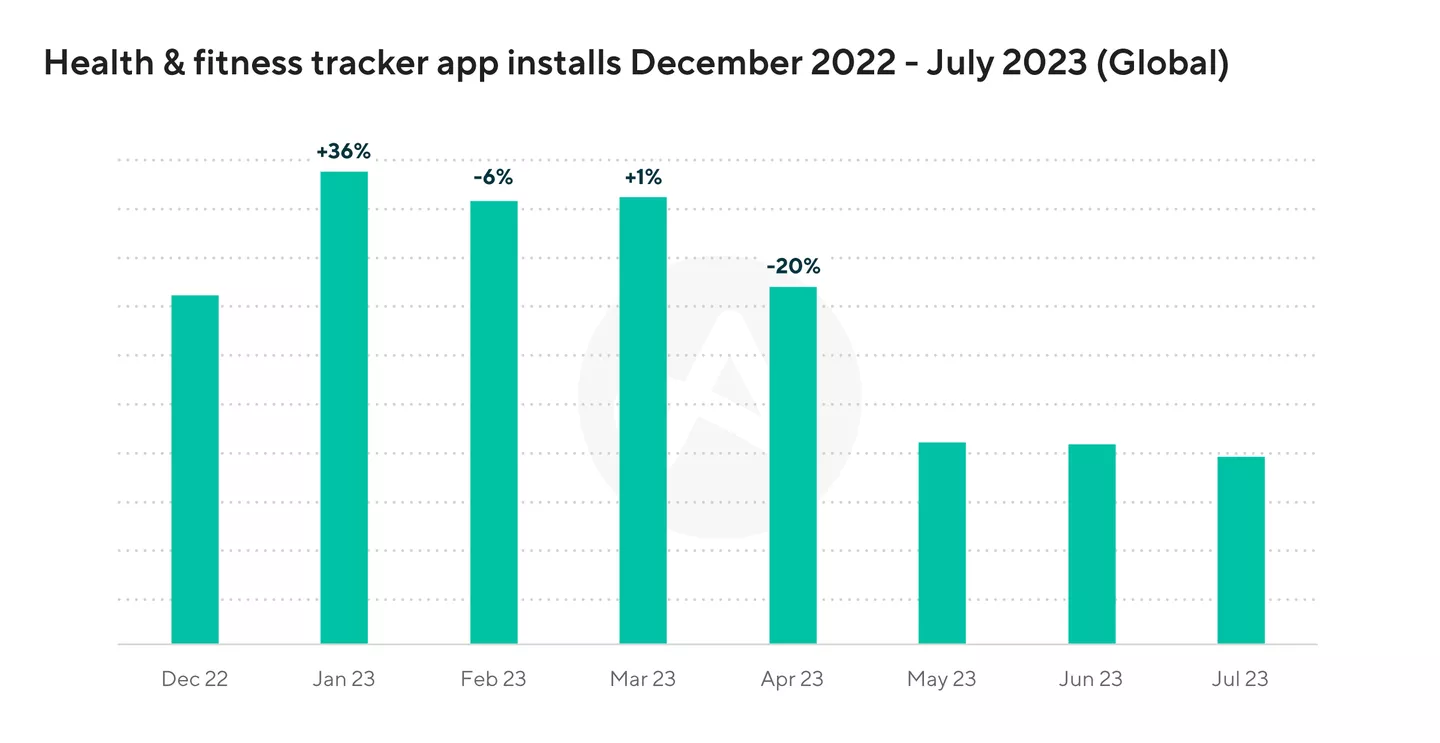
- In January 2023, global installments of health and fitness tracker apps have increased by 36% from the last months.
- Furthermore, global installments in the next months of 2023 are followed by February (-6%), March (+1%), and April (-20%).
Fitness Trackers Statistics by Shipments
- According to Volza’s Global Reports 2023, the import and export shipment of fitness trackers around the world is 2.2K.
- Top importers of fitness trackers shipments are followed by India (1,069), the United States (210), and Bangladesh (145).
- The top 3 product categories that are imported around the world are HSN Code 85176290, HSN Code 90318000, and HSN Code 90291090.
- Top exporters of fitness trackers statistics by shipments are followed by China (1,260), the United States (410), and India (138).
- The top 3 product categories that are exported around the world are HSN Code 85176290, HSN Code 90291090, and HSN Code 90318000.
- As of reports, in 2023 there are 538 buyers and 421 suppliers spread across 45 and 32 countries respectively.
- Top country buyers are followed by India (108), the United States (58), and the Philippines (50).
- Top country suppliers are followed by India (1059), the United States (207), and Bangladesh (124).
Conclusion
After completing the article on Fitness Tracker Statistics, it can be stated that this technological device market is growing rapidly around the world due to its beneficial capability of tracking several physical fitness activities. This article includes several statistical analyses that will positively motivate people across the world so, that they can understand the importance of fitness trackers and can buy one for themselves or family members to enjoy the effective benefits of this device.
Related
Trending Products

Cooler Master MasterBox Q300L Micro-ATX Tower with Magnetic Design Dust Filter, Transparent Acrylic Side Panel, Adjustable I/O & Fully Ventilated Airflow, Black (MCB-Q300L-KANN-S00)

ASUS TUF Gaming GT301 ZAKU II Edition ATX mid-Tower Compact case with Tempered Glass Side Panel, Honeycomb Front Panel, 120mm Aura Addressable RGB Fan, Headphone Hanger,360mm Radiator, Gundam Edition

ASUS TUF Gaming GT501 Mid-Tower Computer Case for up to EATX Motherboards with USB 3.0 Front Panel Cases GT501/GRY/WITH Handle

be quiet! Pure Base 500DX ATX Mid Tower PC case | ARGB | 3 Pre-Installed Pure Wings 2 Fans | Tempered Glass Window | Black | BGW37

ASUS ROG Strix Helios GX601 White Edition RGB Mid-Tower Computer Case for ATX/EATX Motherboards with tempered glass, aluminum frame, GPU braces, 420mm radiator support and Aura Sync


